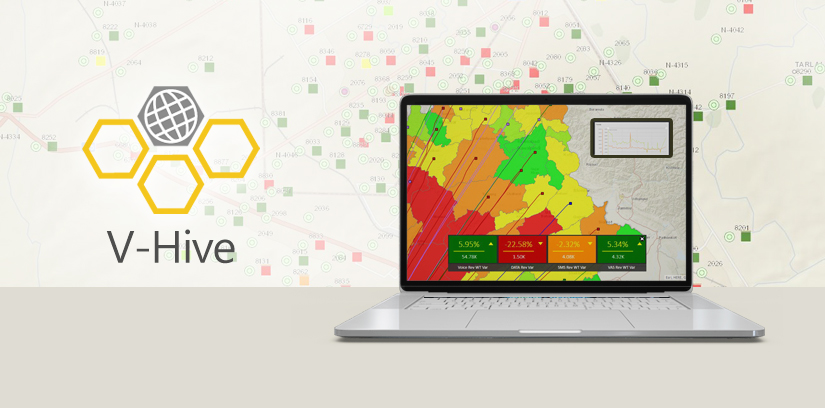
V-Hive

V-Hive is a comprehensive and easy to use geographic information system (GIS) solution for business managers to have consolidated insights of all business units geospatially. The use of geographic information systems (GIS) and location-based information has become vital for effective decision making. Leading telecommunication, utility companies and governments leverage LMKT’s industry-leading GIS domain knowledge for enhanced business intelligence.
LMKT’s V-Hive relies on a cluster-based business assessment approach that highlights the performance of businesses against different pre-defined key performance indicators (KPIs) using a unified interface.
The platform enables businesses to go back in time and review the performance of the organization on any particular date and time. The objective is to unify all the available complex data and providing a snapshot of current business performance which is easy to access and understandable in context of geography. The visual and analytic tool provides an instant access to the information needed for effective business analysis and decision making.
With enhanced features, V-Hive application is an effective tool offering increased monitoring and the ability to analyze performance of scattered operations for strategic and operational decision making.
Core Features
The dashboard allows businesses to gain visibility of the current situation in terms of different set KPIs; revenue, stock, complaints, etc. through a single dashboard. All the KPIs are further divided into sub-levels to drill down into specifics to analyze trends and their root cause to design smart marketing campaign with the provided attribute based results.
Mapping feature in the application allows comparison of different KPI’s at different geographical administrative levels (national, regional, district etc.) on a map. Business managers can benefit by comparing different time periods to establish trends in the quality of work; whether they’re improving, holding steady, or decreasing. The graphical report collected provides an objective view of business as a whole, and can help address quality issues through further training, goal setting, and/or other corrective actions.

